You're reading the documentation for a development version. For the latest released version, please have a look at v0.2.
Drift of the microwave frequency
Classes used:
General description
tr-EPR experiments usually take quite some time (hours rather than minutes) due to their 2D character, and thus the microwave frequency of the source will drift in some way. This is no problem as long as the drift is small compared to the magnetic field step width.
A necessary prerequisite to figure out how and how much the microwave frequency has changed during the measurement is to record the microwave frequency during the measurement, at least one value per time trace, with necessary accuracy. Using a commercial Bruker setup and software, this is usually not (easily) possible. However, if you use some lab-built software to control your tr-EPR setup, it is entirely up to this software.
The following example demonstrates what is possible when the relevant information is available for each individual time trace. Basically, the recipe creates three plots: microwave frequency as function of the magnetic field, microwave frequency drift in absolute values, and the relative drift with respect to the step width of the magnetic field. Only if the relative drift is comparable (or even larger) than the field step will the measurement be affected.
Recipe
 1format:
 2  type: ASpecD recipe
 3  version: '0.2'
 4
 5settings:
 6  default_package: trepr
 7
 8directories:
 9  datasets_source: ../../tests/testdata/
10
11datasets:
12- source: speksim/
13  id: data
14
15tasks:
16- kind: singleanalysis
17  type: MWFrequencyValues
18  apply_to: data
19  result: mwfreq
20- kind: singleplot
21  type: SinglePlotter1D
22  properties:
23    parameters:
24      tight_layout: true
25    properties:
26      figure:
27        dpi: 300
28      axes:
29        title: Microwave frequency
30    filename: mwfreq.png
31  apply_to: mwfreq
32- kind: singleanalysis
33  type: MWFrequencyDrift
34  properties:
35    parameters:
36      kind: drift
37      output: dataset
38  apply_to: data
39  result: mwfreq-drift
40- kind: singleplot
41  type: SinglePlotter1D
42  properties:
43    parameters:
44      tight_layout: true
45    properties:
46      figure:
47        dpi: 300
48      axes:
49        title: Microwave frequency drift (absolute)
50    filename: mwfreq-drift.png
51  apply_to: mwfreq-drift
52- kind: singleanalysis
53  type: MWFrequencyDrift
54  properties:
55    parameters:
56      kind: ratio
57      output: dataset
58  apply_to: data
59  result: mwfreq-ratio
60- kind: singleplot
61  type: SinglePlotter1D
62  properties:
63    parameters:
64      tight_layout: true
65    properties:
66      figure:
67        dpi: 300
68      axes:
69        title: Microwave frequency drift (relative to field step width)
70    filename: mwfreq-ratio.png
71  apply_to: mwfreq-ratio
Result
The recipe actually creates three figures presented afterwards.
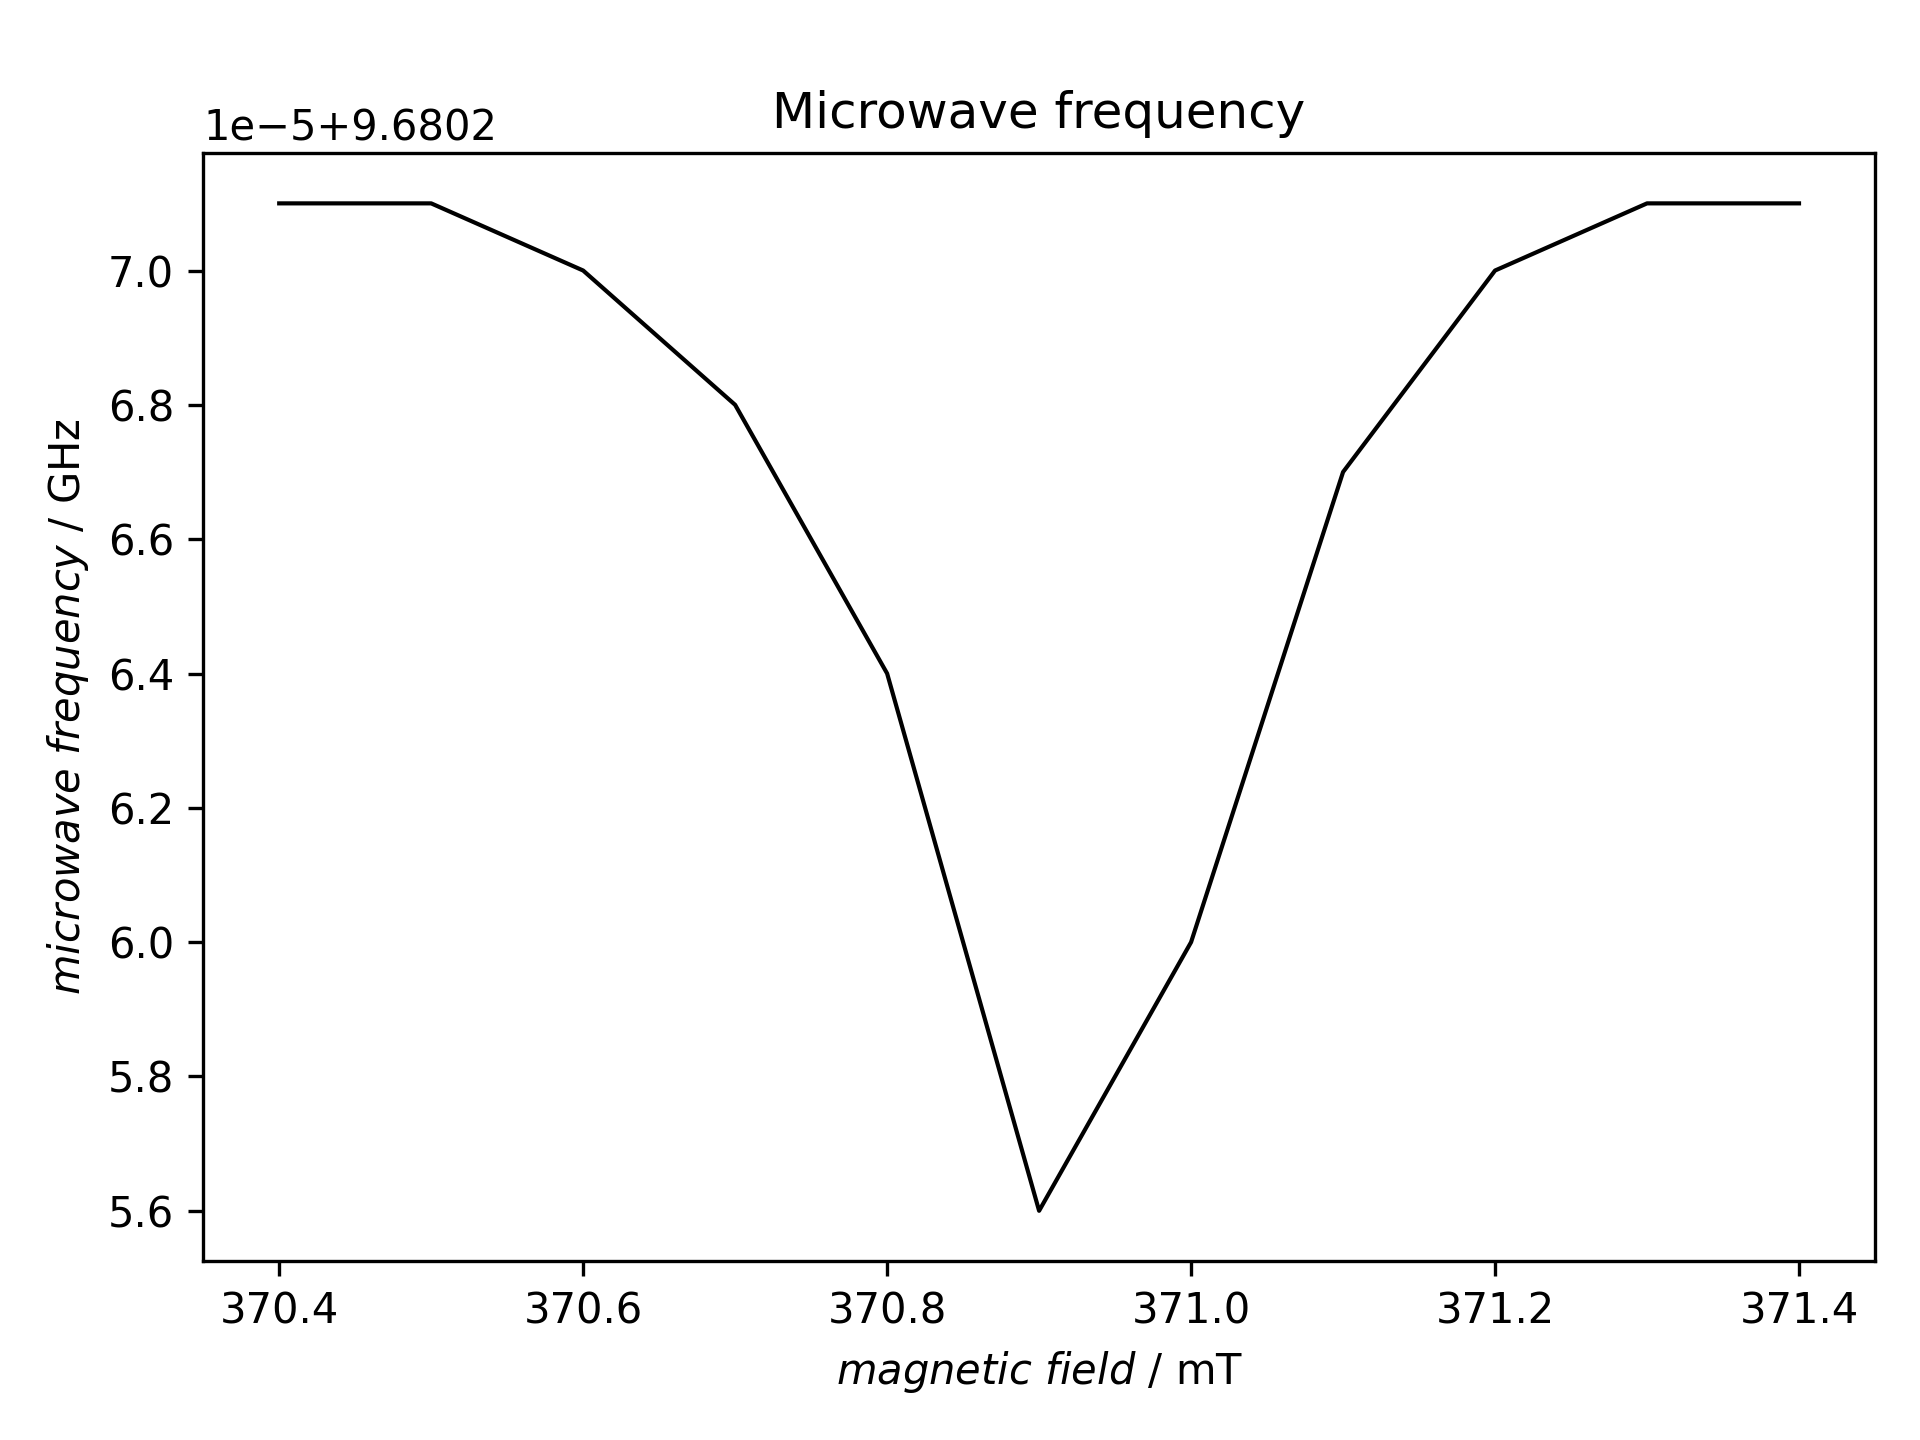
Microwave frequency as function of the magnetic field. The perhaps unexpected shape results from the fact that the data have not been recorded from low to high field (or vice versa), but inside out or outside in.
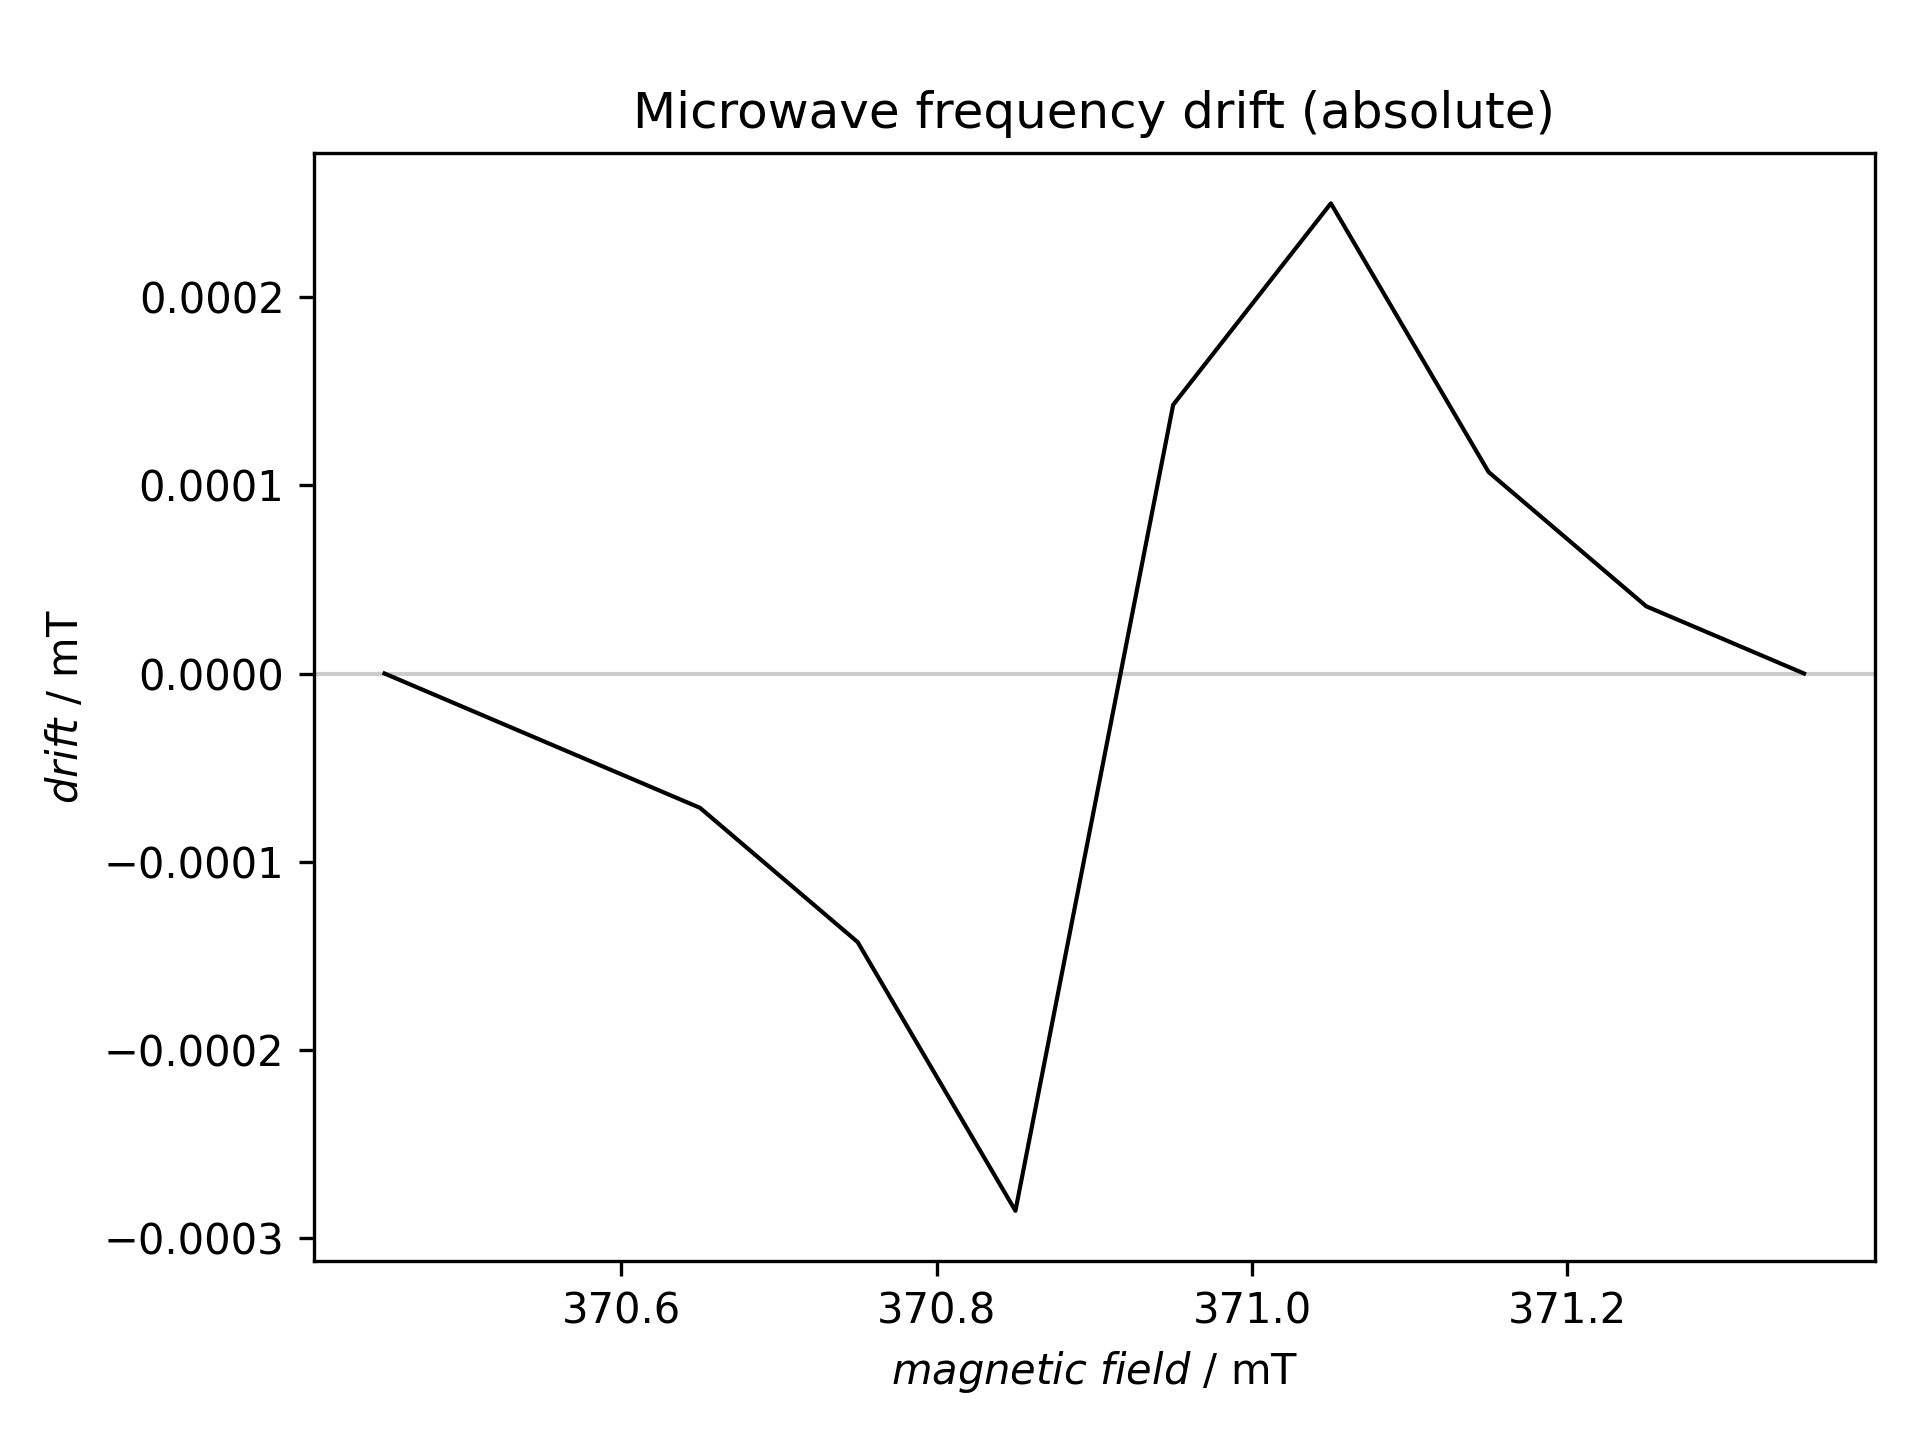
Absolute drift of the microwave frequency expressed in magnetic field units (mT) as function of the magnetic field. The perhaps unexpected shape results from the fact that the data have not been recorded from low to high field (or vice versa), but inside out or outside in.
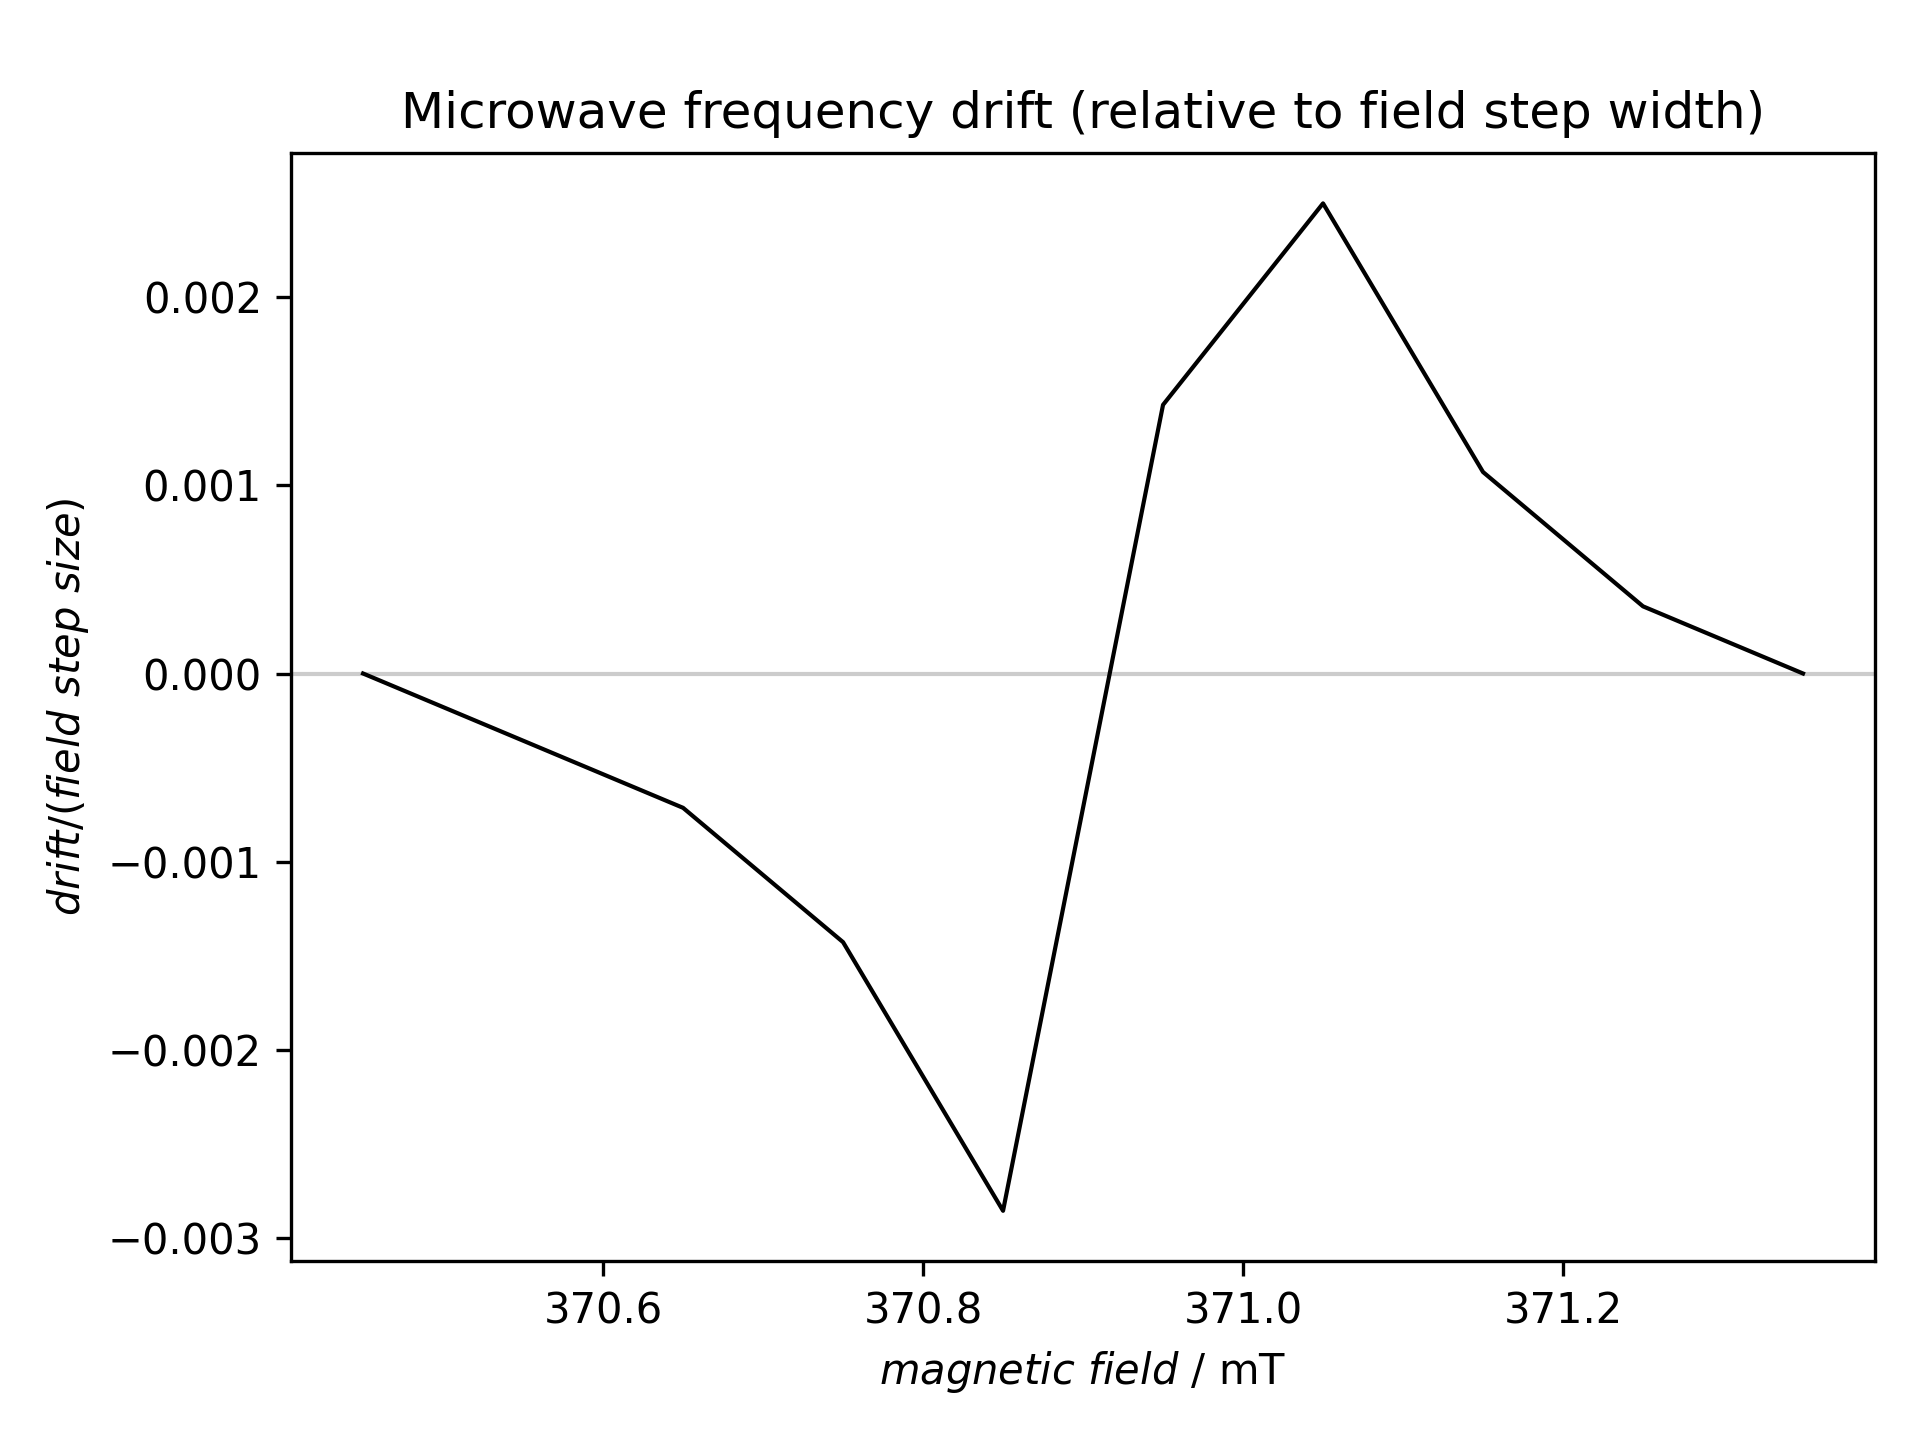
Relative drift of the microwave frequency expressed as magnetic field step ratio as function of the magnetic field. Only if these values are in the dimension of 1 (or even larger) will the measurement be affected. The perhaps unexpected shape results from the fact that the data have not been recorded from low to high field (or vice versa), but inside out or outside in.