Characteristics of a dataset
As with all kinds of data, one of the first and most important steps is to get an overview of the resulting data and their characteristics. Furthermore, with a growing number of different measurements, keeping an overview is crucial. This is the realm of well-crafted, expressive graphical representations that are automatically generated, thus uniform and highly appropriate to compare different datasets and focus on their respective differences.
For tr-EPR data in particular, things get somewhat more complicated due to the two-dimensional nature of the data (magnetic field, time). One strategy to get a decent overview of the characteristics of a dataset would be:
Graphical overview of the entire dataset (2D plot),
Transients (slices along the time axis) at both, global maximum and global minimum, and
Spectra (slices along the magnetic field axis) at both, global maximum and global minimum.
Of course, prior to plotting, the usual corrections (pretrigger offset compensation, background correction) need to be applied.
Recipe
1 2 3 4 5 6 7 8 9 10 11 12 13 14 15 16 17 18 19 20 21 22 23 24 25 26 27 28 29 30 31 32 33 34 35 36 37 38 39 40 41 42 43 44 45 46 47 48 49 50 51 52 53 54 55 56 57 58 59 60 61 62 63 64 65 66 67 68 69 70 71 72 73 74 75 76 77 78 79 80 81 82 83 84 85 86 87 88 89 90 91 92 93 94 95 96 97 98 99 100 101 102 103 104 105 106 107 108 109 110 111 112 113 114 115 116 117 118 119 120 121 122 123 124 125 126 127 128 129 130 131 132 133 134 135 136 137 138 139 140 141 142 143 144 145 146 147 148 | format:
type: ASpecD recipe
version: '0.2'
settings:
default_package: trepr
autosave_plots: false
directories:
datasets_source: ../../tests/testdata/fsc2/
datasets:
#- radical-pair
- triplet
tasks:
- kind: processing
type: PretriggerOffsetCompensation
comment: >
Compensate for DC offsets of the signal prior to the laser flash
- kind: processing
type: BackgroundCorrection
comment: >
Correct for laser-induced background signal.
- kind: singleanalysis
type: BasicCharacteristics
properties:
parameters:
kind: max
output: indices
axis: 0
result: max_field
comment: Extract index of field axis for global maximum of the dataset
- kind: singleanalysis
type: BasicCharacteristics
properties:
parameters:
kind: min
output: indices
axis: 0
result: min_field
comment: Extract index of field axis for global minimum of the dataset
- kind: singleanalysis
type: BasicCharacteristics
properties:
parameters:
kind: max
output: indices
axis: 1
result: max_time
comment: Extract index of time axis for global maximum of the dataset
- kind: singleanalysis
type: BasicCharacteristics
properties:
parameters:
kind: min
output: indices
axis: 1
result: min_time
comment: Extract index of time axis for global minimum of the dataset
- kind: processing
type: SliceExtraction
properties:
parameters:
position: max_field
axis: 0
result: time_trace_max
comment: Extract transient for global maximum of the dataset
- kind: processing
type: SliceExtraction
properties:
parameters:
position: min_field
axis: 0
result: time_trace_min
comment: Extract transient for global minimum of the dataset
- kind: processing
type: SliceExtraction
properties:
parameters:
position: max_time
axis: 1
result: spectrum_max
comment: Extract spectrum for global maximum of the dataset
- kind: processing
type: SliceExtraction
properties:
parameters:
position: min_time
axis: 1
result: spectrum_min
comment: Extract spectrum for global minimum of the dataset
- kind: multiplot
type: MultiPlotter1D
properties:
parameters:
switch_axes: true
tight_layout: true
tight: y
properties:
grid:
show: true
axis: y
apply_to:
- time_trace_max
- time_trace_min
result: transients
- kind: multiplot
type: MultiPlotter1D
properties:
parameters:
tight_layout: true
tight: x
properties:
grid:
show: true
axis: x
apply_to:
- spectrum_max
- spectrum_min
result: spectra
- kind: singleplot
type: SinglePlotter2D
properties:
parameters:
tight_layout: true
properties:
figure:
dpi: 300
type: contourf
result: 2D
- kind: compositeplot
type: CompositePlotter
properties:
properties:
figure:
dpi: 150
size: [8, 8]
grid_dimensions: [2, 2]
subplot_locations:
- [0, 0, 1, 1]
- [0, 1, 1, 1]
- [1, 0, 1, 1]
plotter:
- 2D
- transients
- spectra
filename: characteristics.png
|
Result
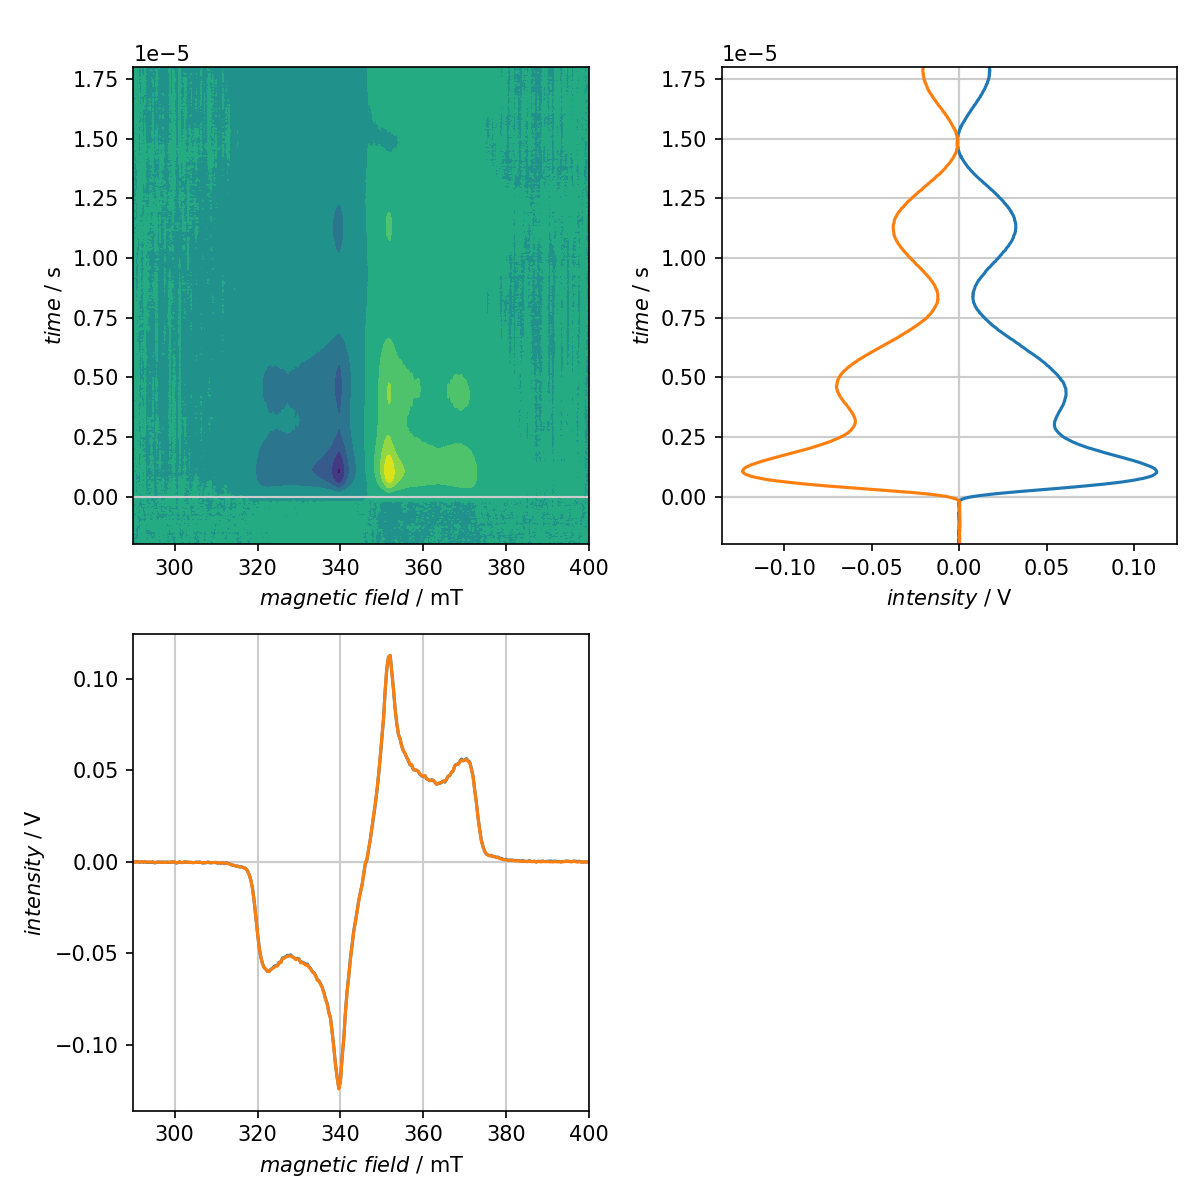
Characteristics of a tr-EPR dataset at a glance. The 2D plot in the top left panel provides an overview of the entire dataset, while the transients and spectra obtained for the global maximum and minimum, respectively, are presented parallel to the corresponding axes of the 2D plot. In this particular case, the spectra for maximum and minimum entirely overlap, meaning that maximum and minimum of the signal occur at the same time after the laser flash.